Note
Go to the end to download the full example code
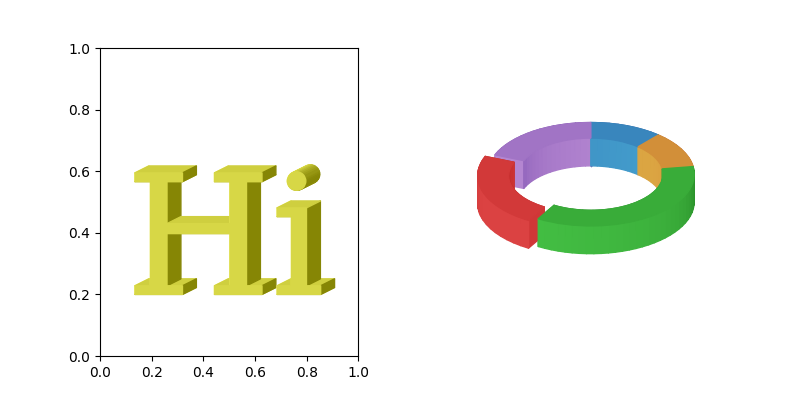
Demo with text and pie chart
import numpy as np

import matplotlib.pyplot as plt
import matplotlib.colors as mcolors
import matplotlib.transforms as mtransforms

from matplotlib.text import TextPath
from matplotlib.patches import PathPatch

# from poormans_3d_demo import demo
from mpl_poormans_3d import Poormans3d, Poormans3dFace
from mpl_poormans_3d.poormans_3d import ArtistListWithPoormans3d
# from mpl_visual_context.artist_helper import ArtistListWithPE
from matplotlib.colors import LightSource


fig, axs_ = plt.subplots(1, 2, num=1, clear=True, figsize=(8, 4))
axs = axs_.flat
fig.subplots_adjust(wspace=0.4)

ax = axs[0]
t = ax.text(0.1, 0.2, "Hi", size=120, family="serif", color="y")

ls = LightSource(azdeg=180+105)

t.set_path_effects([
    Poormans3d(ls, (10, 5), fraction=0.9),
    Poormans3dFace(ls, (0, 0), fraction=0.9),
])

ax = axs[1]
frequency = [120,120,380,240,200]
pie = ax.pie(frequency,
             startangle=90,
             counterclock=False,
             wedgeprops=dict(width=0.3),
             explode=[0, 0, 0, .1, 0],
             )

# We set aspect to .5 so that the pi looks tilted.
ax.set_aspect(0.5)

ls = LightSource(azdeg=35)

patch_list = pie[0]

# The 3d faces of all patches need to be collected and sorted.
# ArtistListWithPoormans3d does this.
height = np.array([0, 40])
kw = dict(fraction=0.3, direction=-1)
kw_face = dict(fraction=0.3)

al = ArtistListWithPoormans3d(patch_list,
                              ls, 0.5* height, displacement0=0,
                              **kw)

ax.add_artist(al)

for patch in patch_list:
    patch.set_path_effects([
        Poormans3dFace(ls, 0.5*height, **kw_face),
    ])

plt.show()
Total running time of the script: (0 minutes 0.242 seconds)