Note
Go to the end to download the full example code
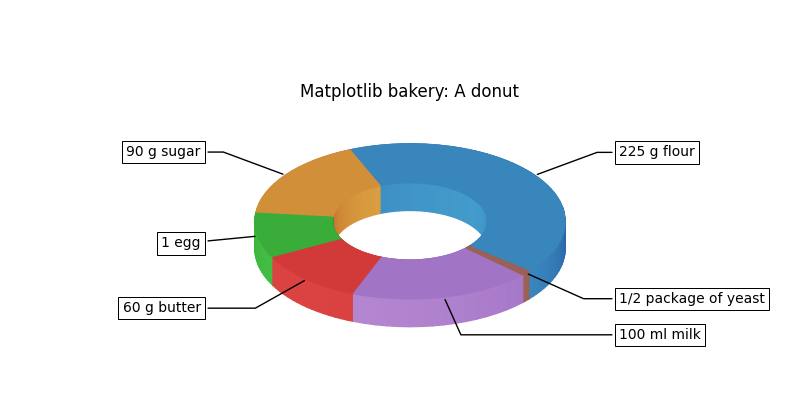
Labeled pie chart
import matplotlib.pyplot as plt
import numpy as np

fig, ax = plt.subplots(num=1, figsize=(8, 4), clear=True)

recipe = ["225 g flour",
          "90 g sugar",
          "1 egg",
          "60 g butter",
          "100 ml milk",
          "1/2 package of yeast"]

data = [225, 90, 50, 60, 100, 5]

wedges, texts = ax.pie(data, wedgeprops=dict(width=0.5), startangle=-40,
                       frame=False)


aspect = 0.5 # aspect will also be used to change the connection style of
             # annotations.
ax.set_aspect(aspect)

ax.set_xlim(-2, 2)
ax.set_ylim(-1, 1.5)
# It helps to draw the pie with frame=True, to get the idea of xlim and ylim.

bbox_props = dict(boxstyle="square,pad=0.3", fc="w", ec="k", lw=0.72)
kw = dict(arrowprops=dict(arrowstyle="-"),
          bbox=bbox_props, zorder=2, va="center")

for i, p in enumerate(wedges):
    ang = (p.theta2 - p.theta1)/2. + p.theta1
    y = np.sin(np.deg2rad(ang))
    x = np.cos(np.deg2rad(ang))

    # We need to recalculate the angle to accound axes aspect.
    ang2 = np.arctan2(y*0.5, x)/np.pi*180
    horizontalalignment = {-1: "right", 1: "left"}[int(np.sign(x))]
    connectionstyle = f"angle,angleA=0,angleB={ang2}"
    kw["arrowprops"].update({"connectionstyle": connectionstyle})
    ax.annotate(recipe[i], xy=(x, y), xytext=(1.35*np.sign(x), 1.5*y),
                horizontalalignment=horizontalalignment,
                **kw)

ax.set_title("Matplotlib bakery: A donut")

# 3d effects
from matplotlib.colors import LightSource
from mpl_poormans_3d import Poormans3d, Poormans3dFace
from mpl_poormans_3d.poormans_3d import ArtistListWithPoormans3d

ls = LightSource(azdeg=35)

patch_list = wedges

# The 3d faces of all patches need to be collected and sorted.
# ArtistListWithPoormans3d does this.
height = np.array([0, -40])
kw = dict(fraction=0.3, direction=1)
kw_face = dict(fraction=0.3)

al = ArtistListWithPoormans3d(patch_list,
                              ls, 0.5* height, displacement0=0,
                              **kw)

ax.add_artist(al)

for patch in patch_list:
    patch.set_path_effects([
        Poormans3dFace(ls, 0, **kw_face),
    ])

plt.show()
Total running time of the script: (0 minutes 0.177 seconds)