Note
Go to the end to download the full example code
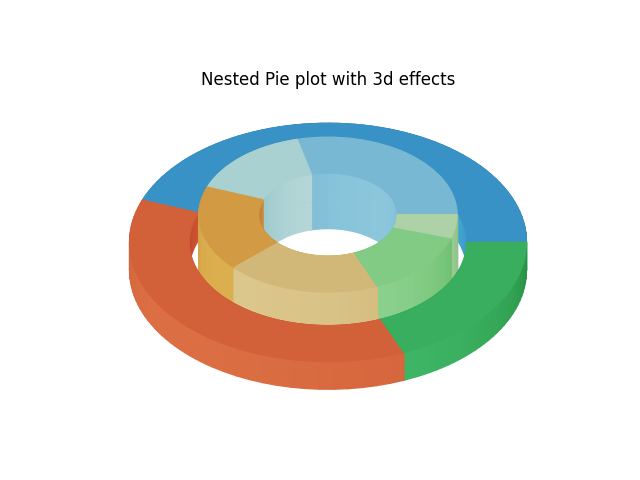
Nested pie chart
import numpy as np
import matplotlib.pyplot as plt

fig, ax = plt.subplots(num=1, clear=True)

size = 0.3
vals = np.array([[60., 32.], [37., 40.], [29., 10.]])

cmap = plt.colormaps["tab20c"]
outer_colors = cmap(np.arange(3)*4)
inner_colors = cmap([1, 2, 5, 6, 9, 10])

wedges1, _ = ax.pie(vals.sum(axis=1), radius=1, colors=outer_colors,
                    wedgeprops=dict(width=size, edgecolor='w'))

wedges2, _ = ax.pie(vals.flatten(), radius=0.95-size, colors=inner_colors,
                    wedgeprops=dict(width=size, edgecolor='w'))

ax.set(aspect=0.6, title='Nested Pie plot with 3d effects')

# 3d effects
from matplotlib.colors import LightSource
from mpl_poormans_3d import Poormans3d, Poormans3dFace
from mpl_poormans_3d.poormans_3d import ArtistListWithPoormans3d

ls = LightSource(azdeg=35)

# We add 3d effects using ArtistListWithPoormans3d and Poomans3dFace. See
# demo_pie.py.
patch_list = wedges1 + wedges2

height = np.array([0, -40])
kw = dict(fraction=0.3, direction=1)
kw_face = dict(fraction=0.3)

al = ArtistListWithPoormans3d(patch_list,
                              ls, 0.5* height, displacement0=0,
                              **kw)

ax.add_artist(al)

for patch in patch_list:
    patch.set_path_effects([
        Poormans3dFace(ls, 0, **kw_face),
    ])


# For the inner wedges, We add another depth
patch_list = wedges2

height = np.array([0, 40])
kw = dict(fraction=0.3, direction=-1)
kw_face = dict(fraction=0.3)

al = ArtistListWithPoormans3d(patch_list,
                              ls, 0.5* height, displacement0=0,
                              **kw)
al.set_zorder(1.2)
ax.add_artist(al)

for patch in patch_list:
    patch.set_path_effects([
        Poormans3dFace(ls, 0.5*height, **kw_face),
    ])
    patch.set_zorder(1.3)

plt.show()
Total running time of the script: (0 minutes 0.210 seconds)